Performance/Benchmarking
Battery Operation Signals
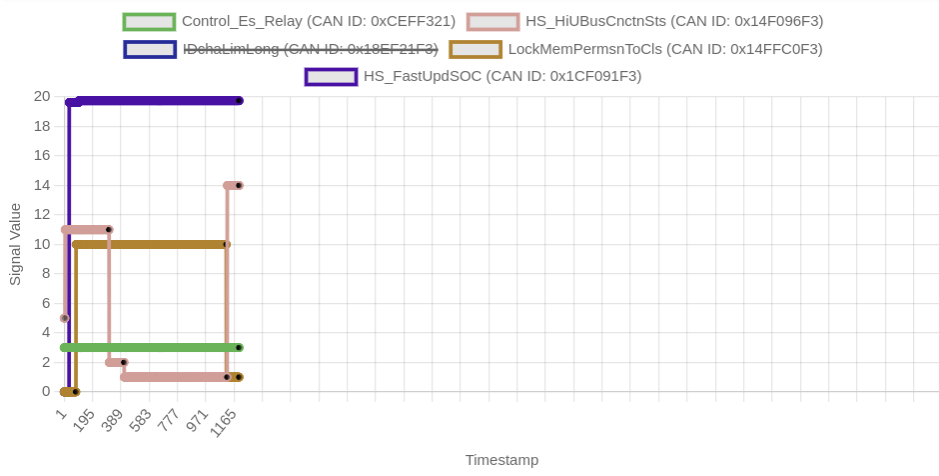
When the user clicks the Connect button on the dashboard, the control_es_relay signal is triggered. Upon setting this signal to 3, the HS_HiUBusCnctnSts signal transitions to 1, indicating that the high-voltage bus is connected and the contactor is closed. The FastUpdSOC signal, which represents the battery's state of charge (SOC), shows a value of 19%. Additionally, the Permission to Close signal is granted and set to 10.
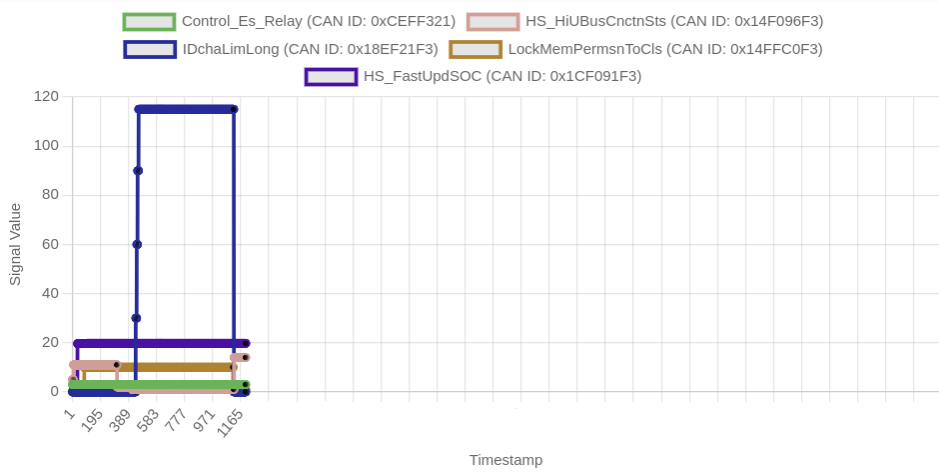
Once the connection is established, the discharge current is measured at 110A while the battery remains at 19% charge. This demonstrates the system's ability to handle high-current discharge during operation.
Data Rate
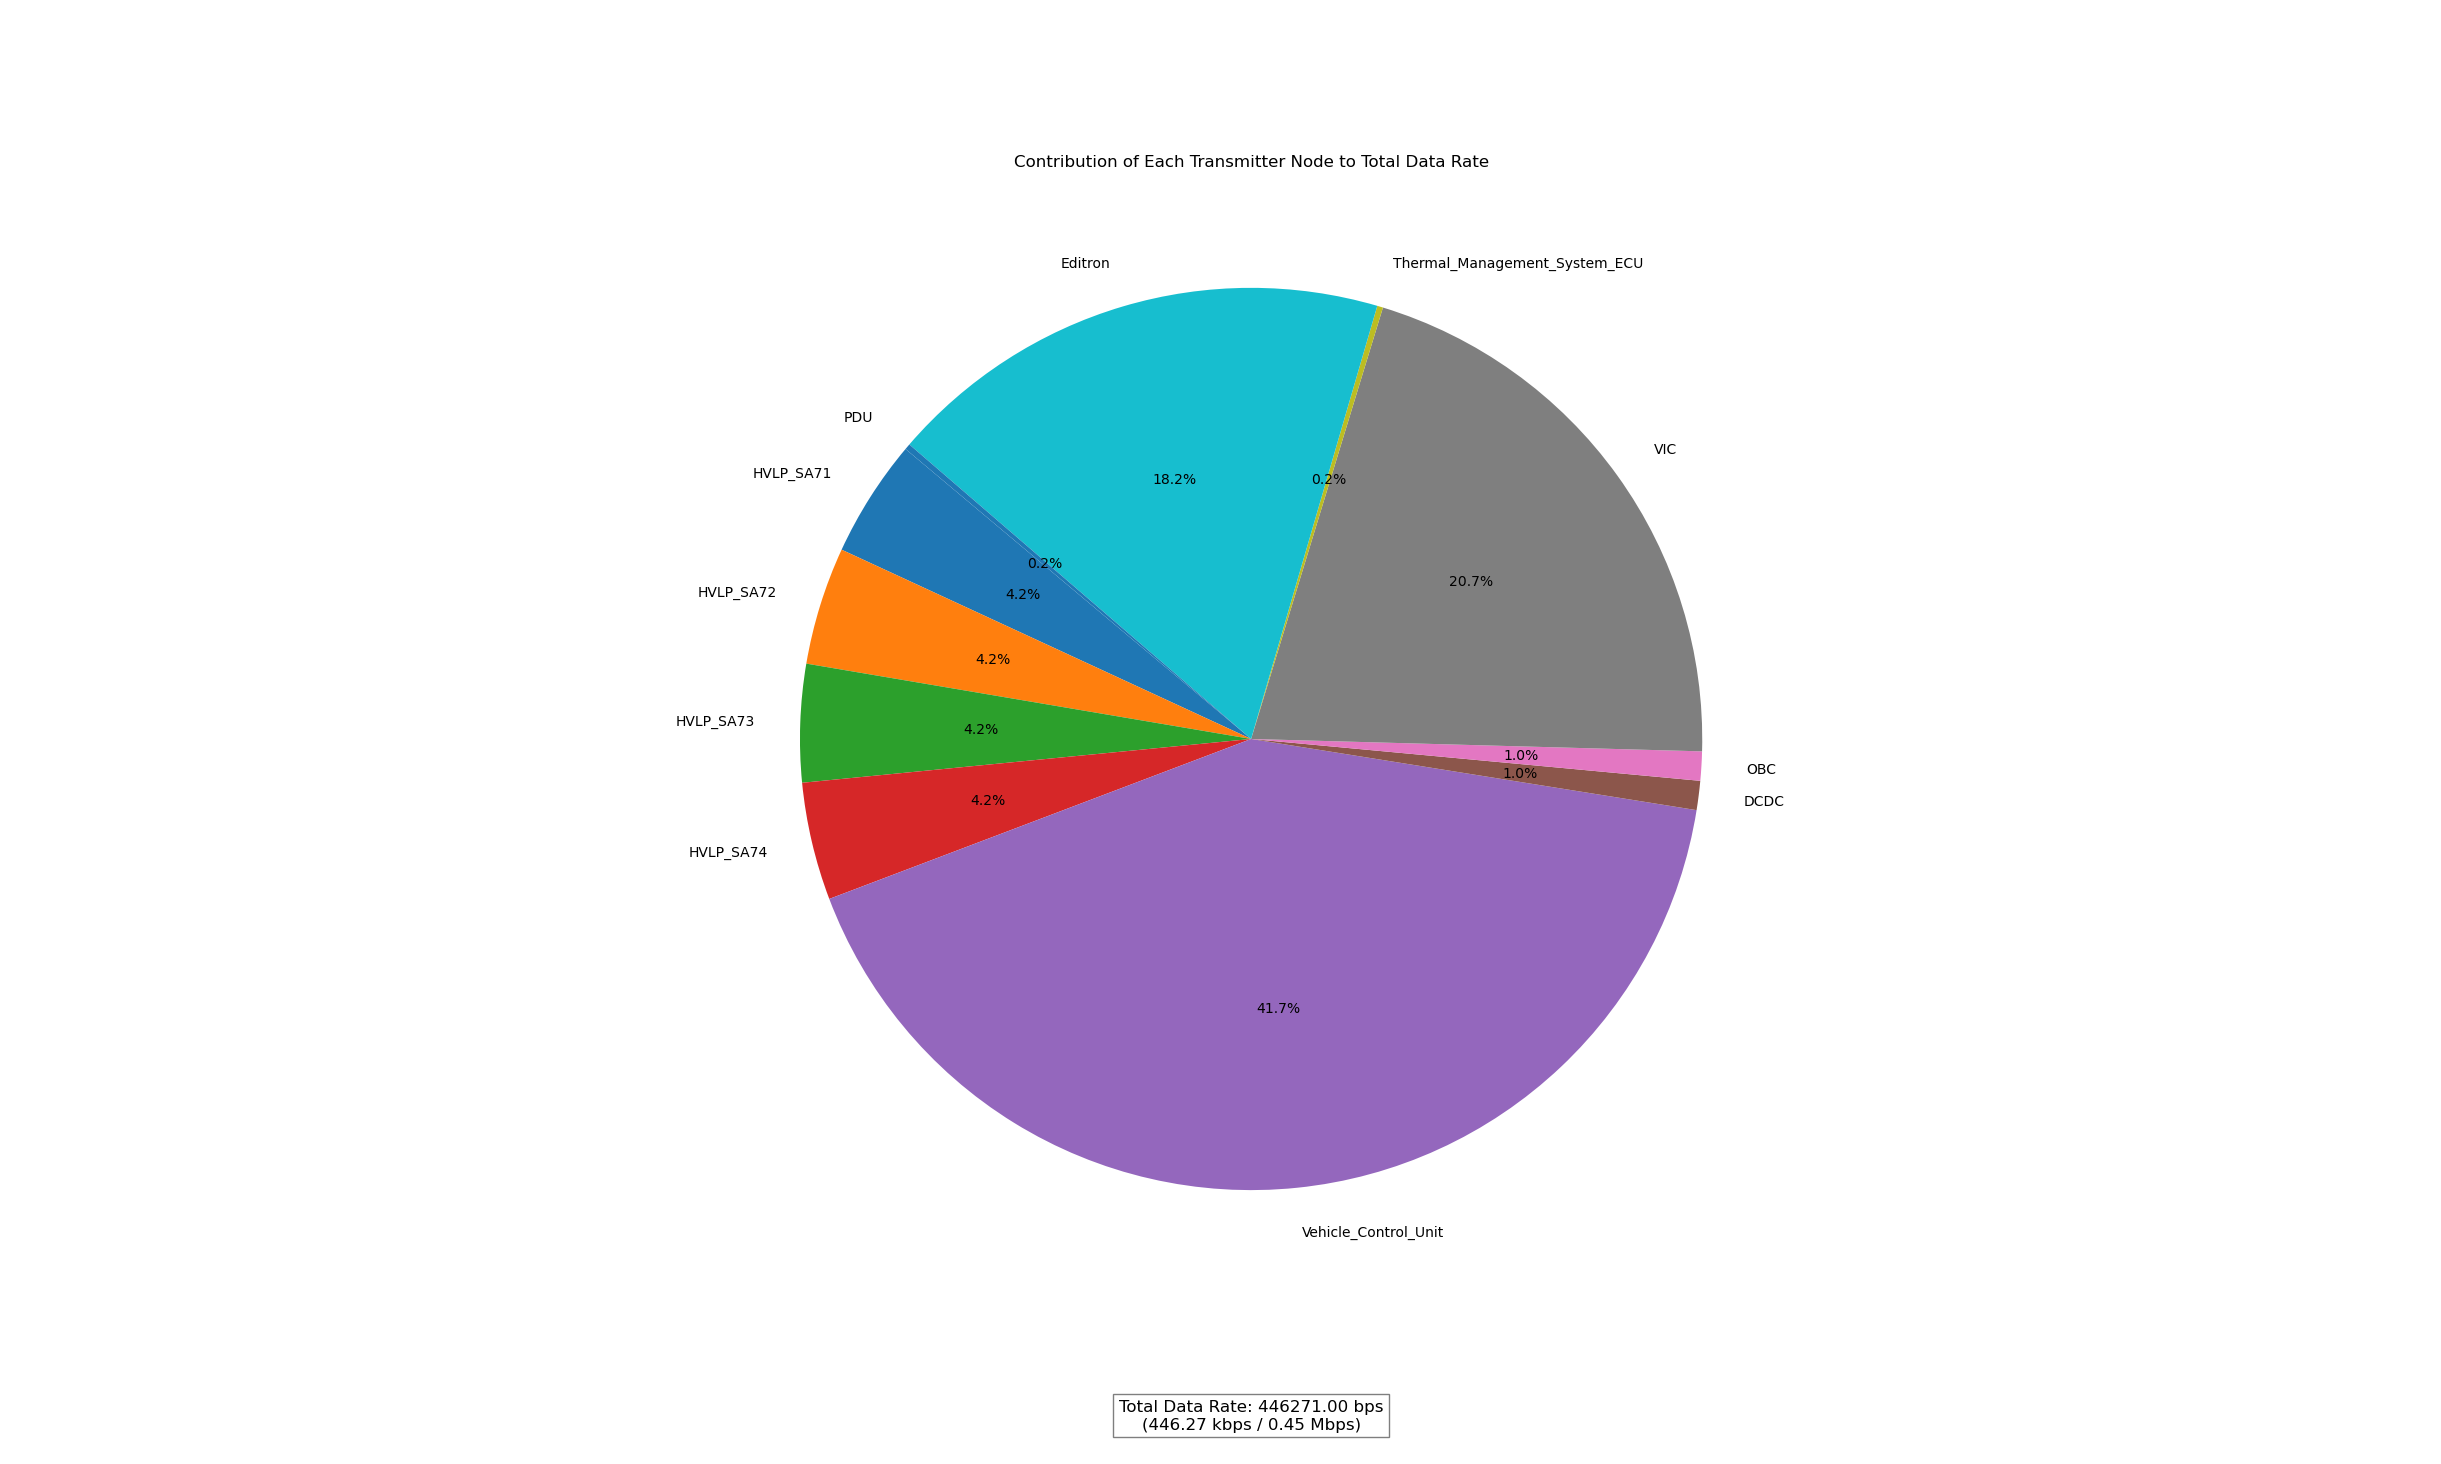
The CAN bus operates at a nominal data rate of 512 kbps. The pie chart above illustrates the distribution of data rates contributed by various nodes on the bus. The VCU (Vehicle Control Unit) contributes the majority of the data, followed by the VIC/VIG (Vehicle Interface Controller/Vehicle Interface Gateway). The total bus utilization is 446 kbps, which is well within the bus capacity.
Message Cycle Time
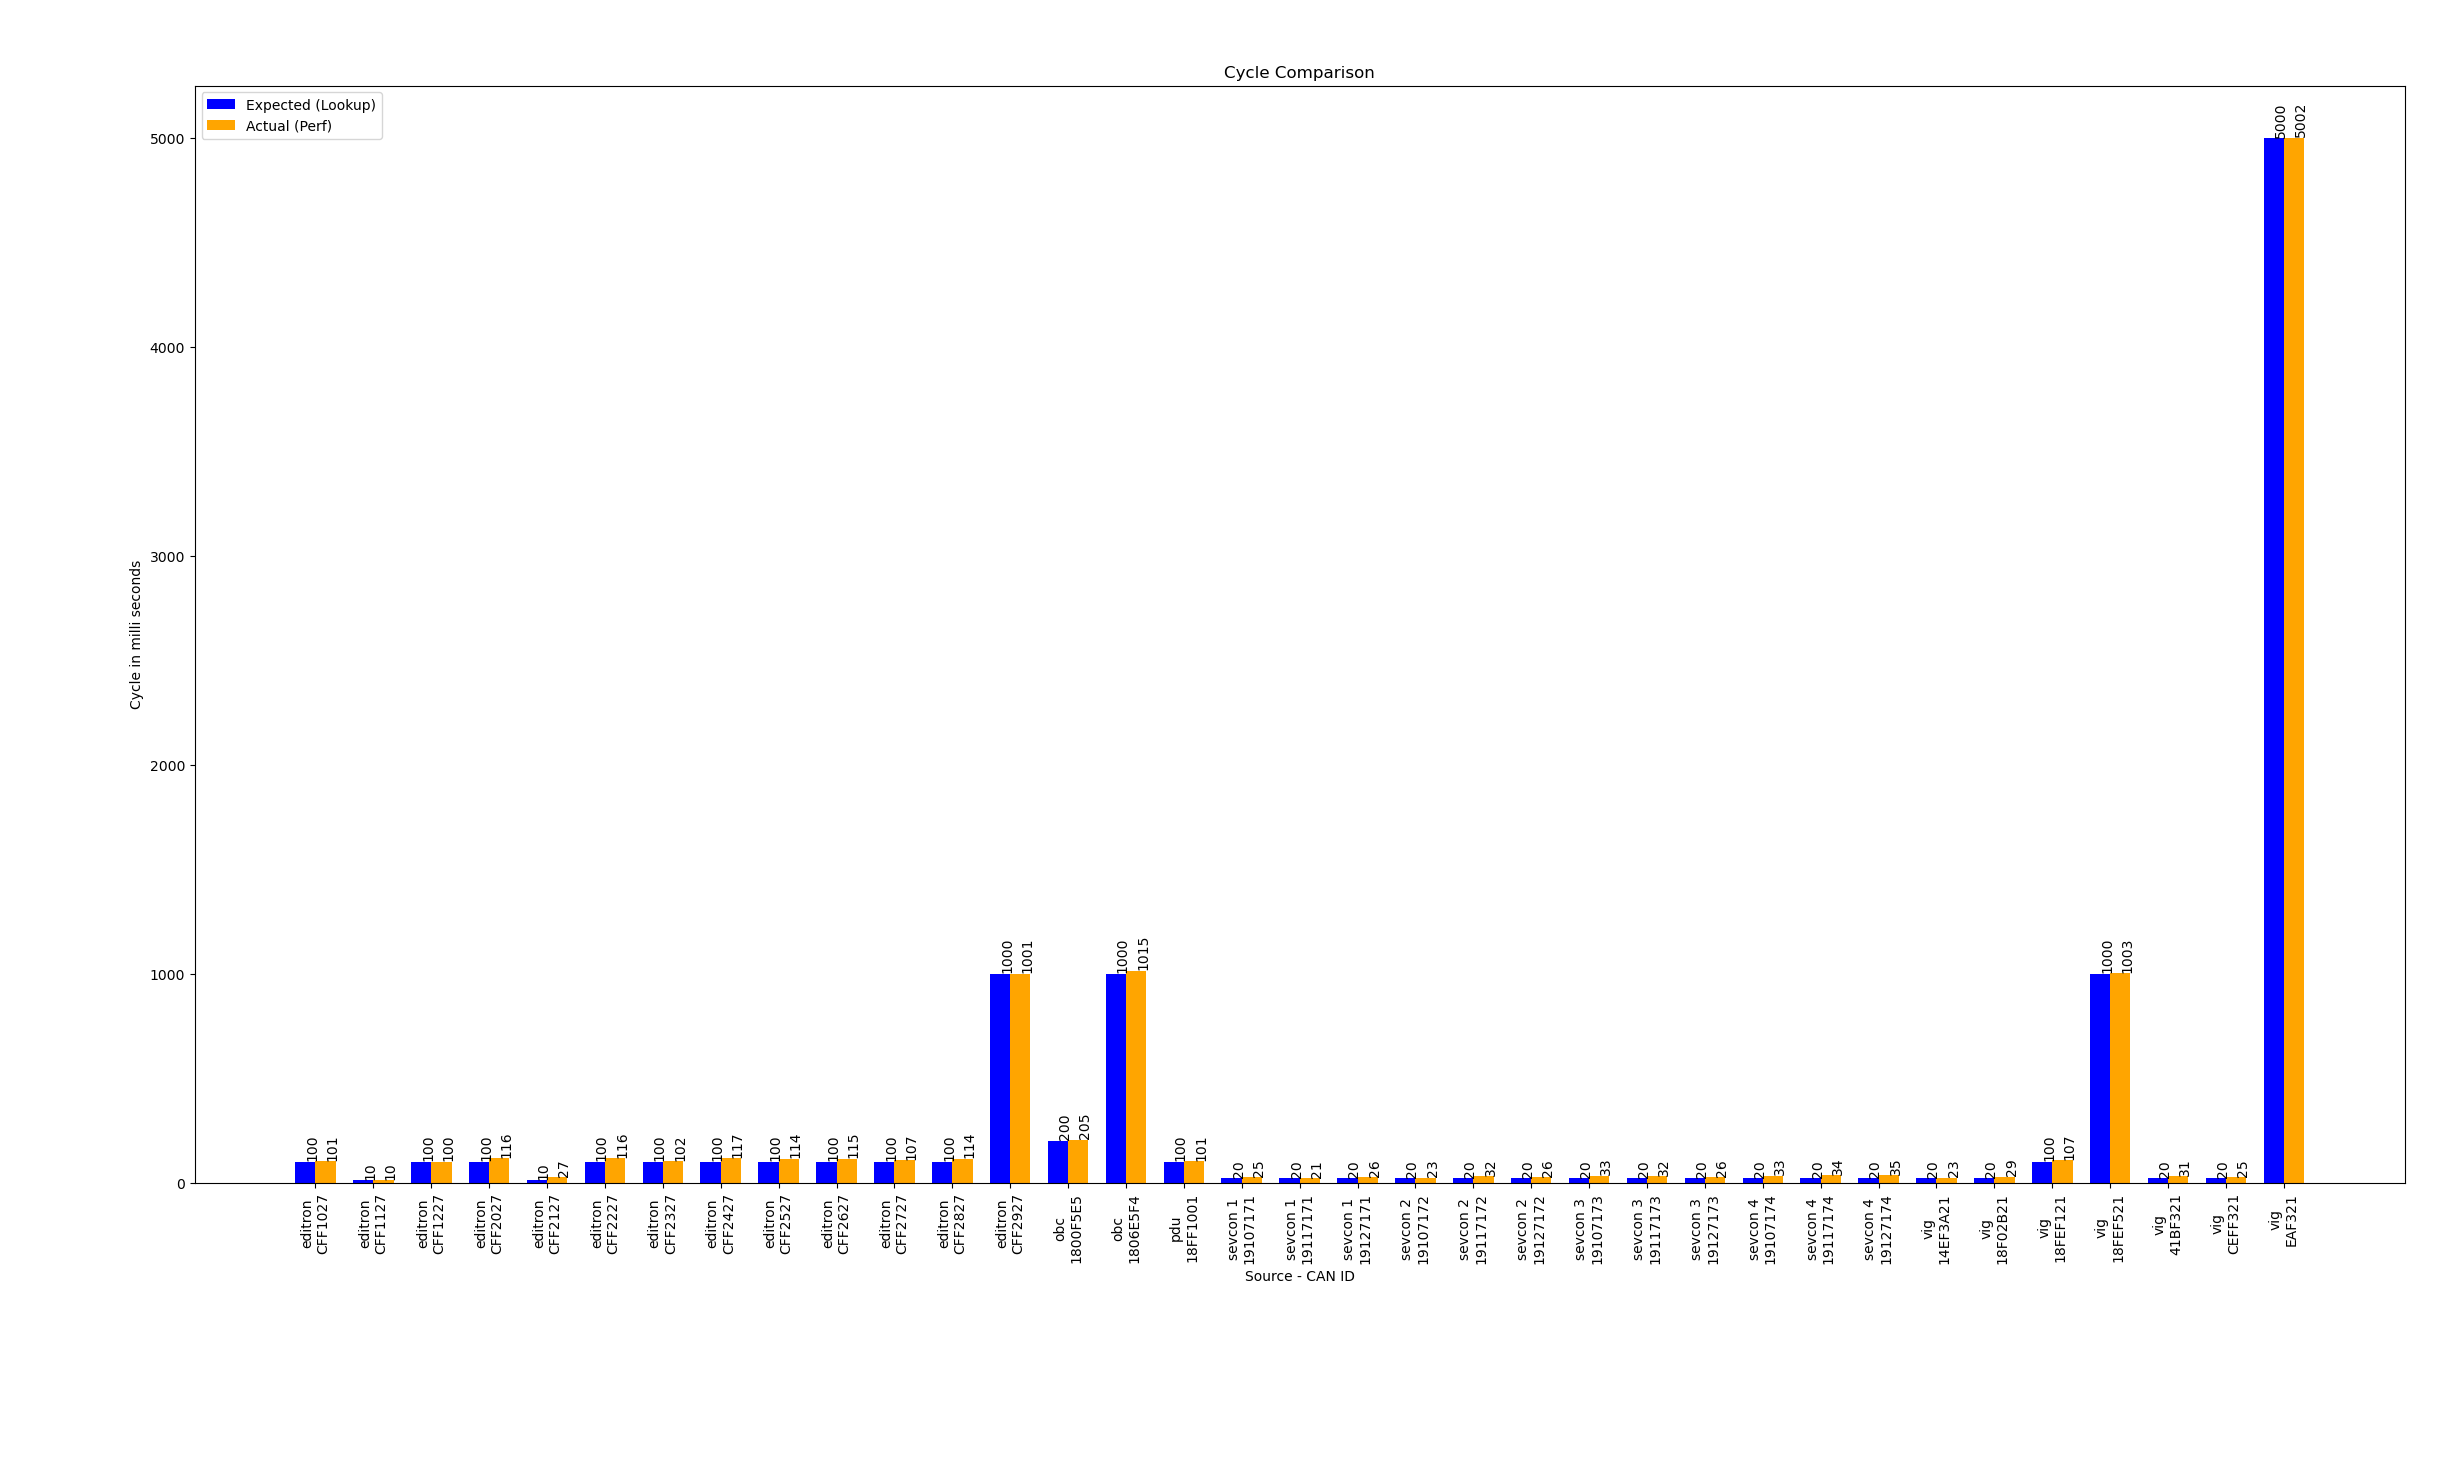
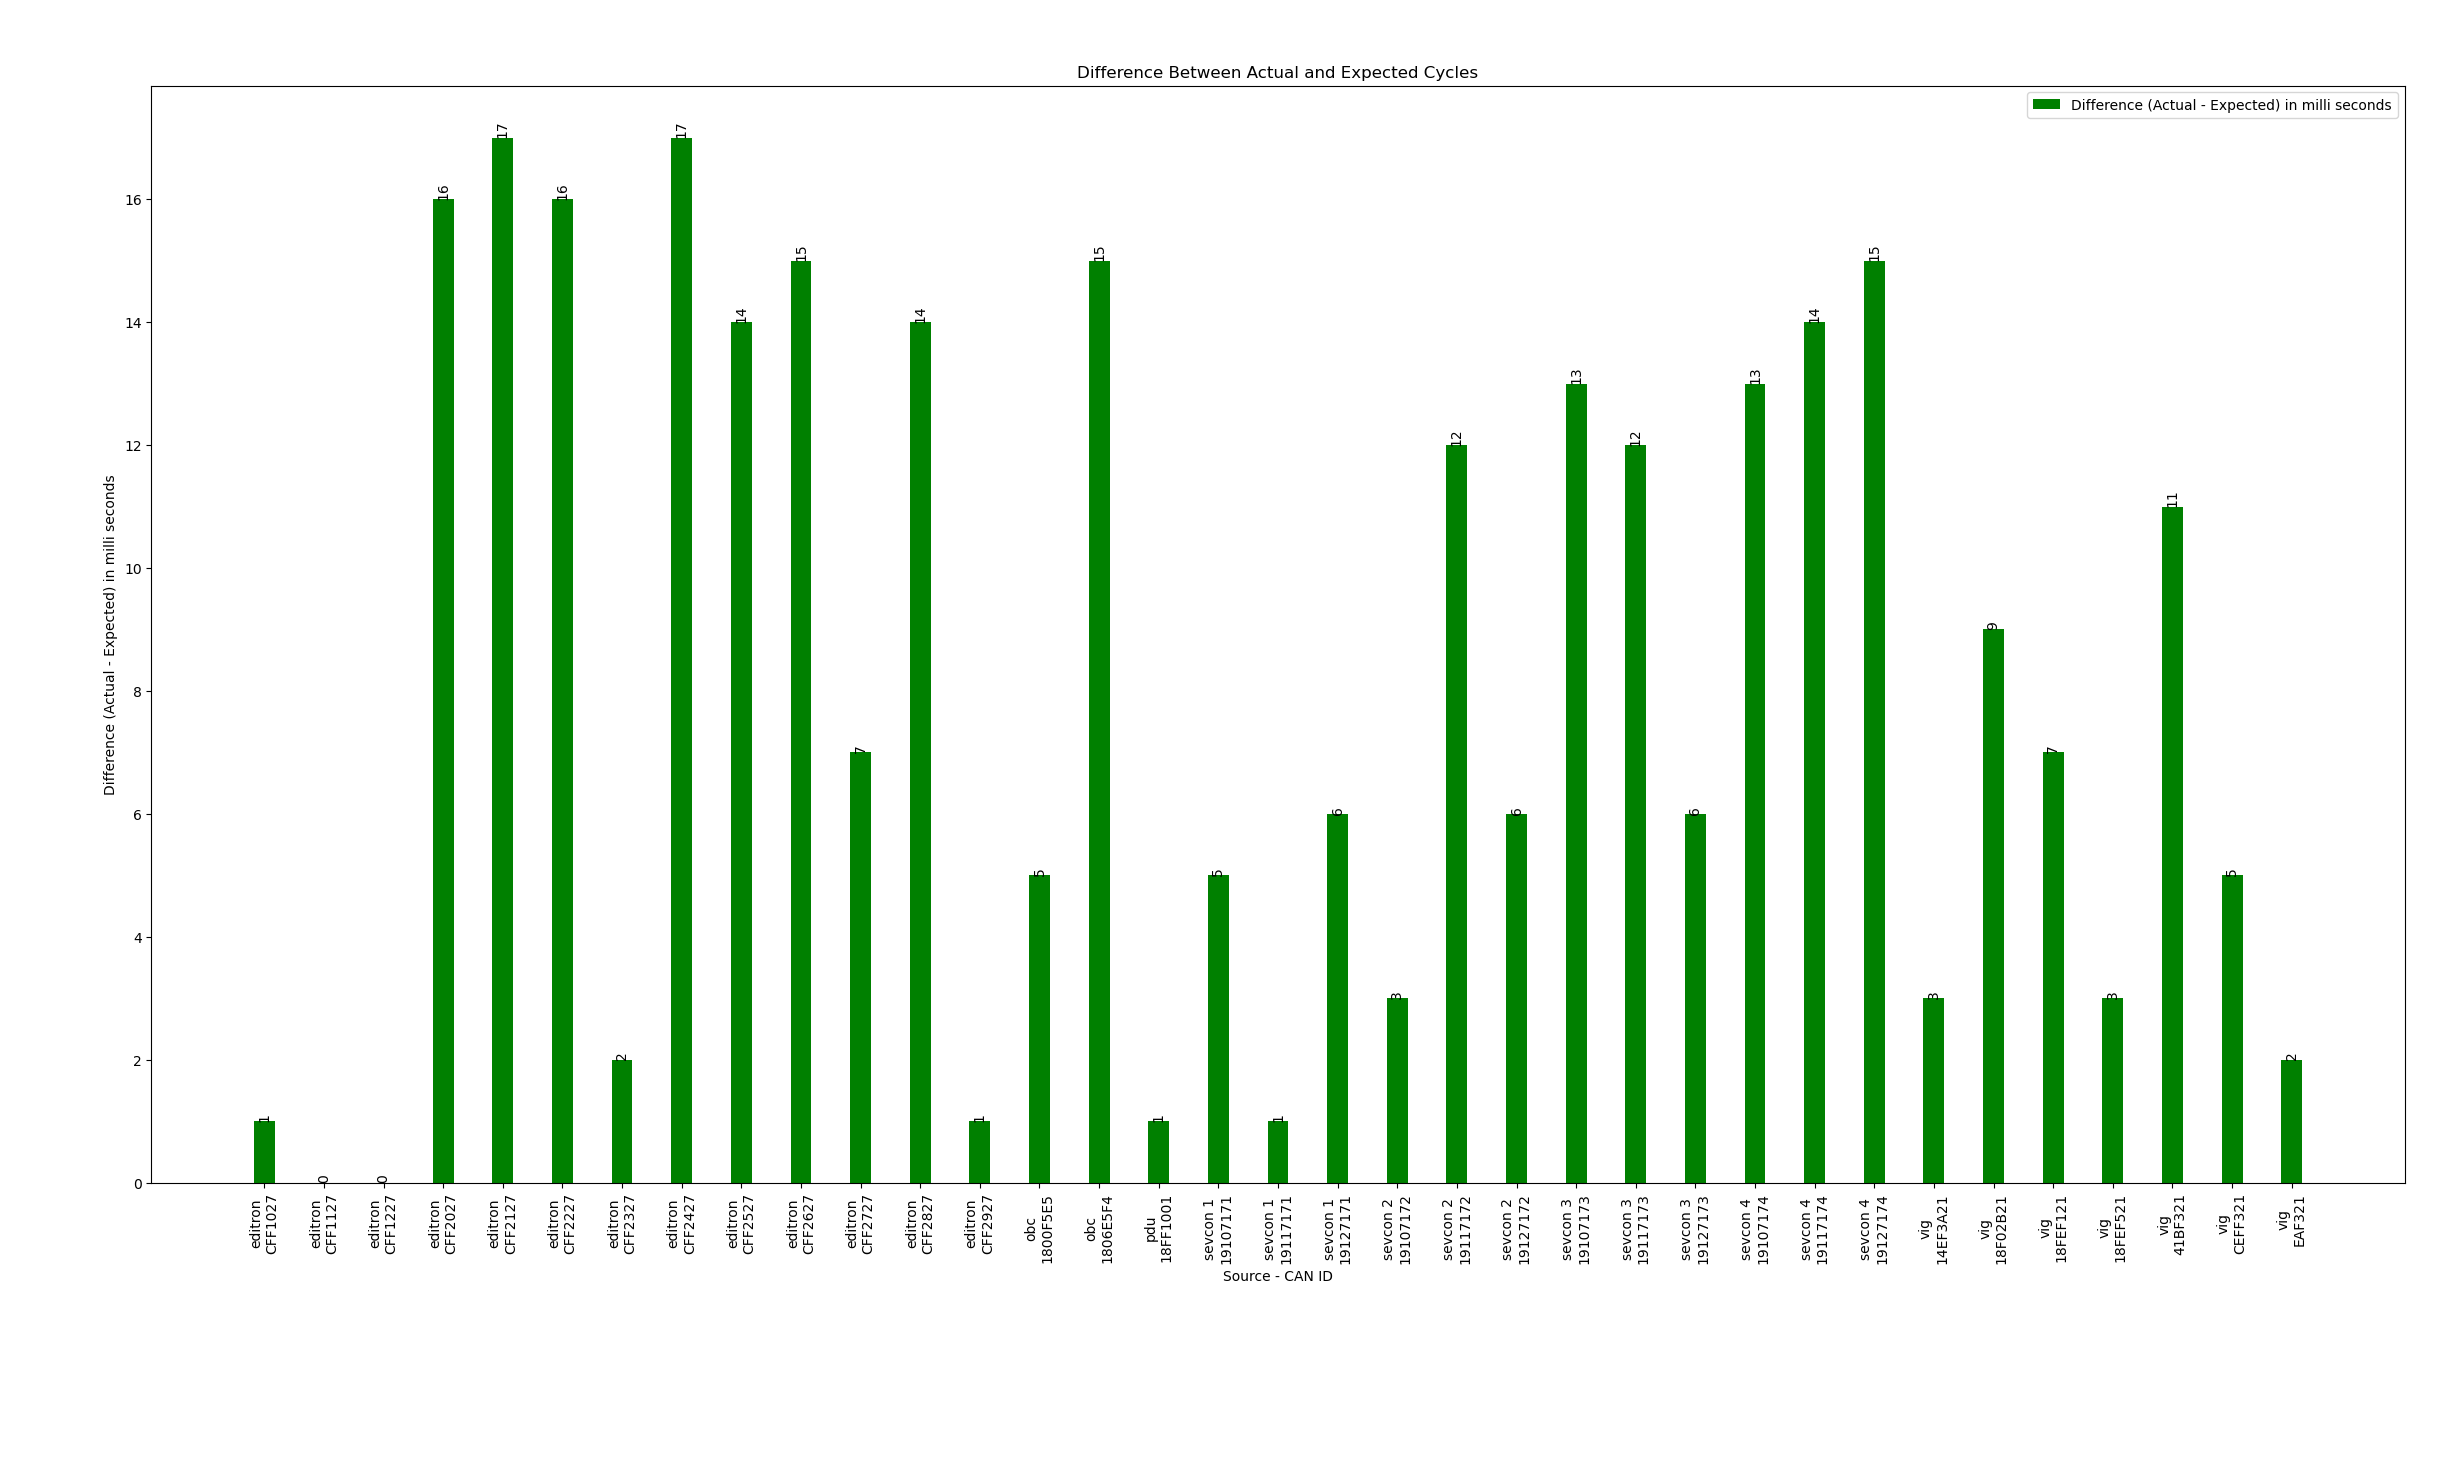
The graph above shows the message cycle times for all nodes during vehicle operation. The cycle times are tightly synchronized, with an average deviation of 10ms, which is within acceptable limits. This synchronization ensures reliable communication, as the receiving nodes have sufficient buffer time to process incoming messages.
The framework achieves this efficiency by using the following logic in the CAN Sender class:
- Each message's cycle time is added to the current timestamp.
- Before sending a message, the system checks if the current time has exceeded the sum of the cycle time and the previous timestamp.
This graph depicts the difference between the actual and required cycle times. The minimal deviation highlights the framework's precision in maintaining consistent message timing.
CPU and Memory Usage
| Metric | Value |
|---|---|
| CPU Usage | 194.0% (Using ~2 cores) |
| Virtual Memory | ~1.1 GB (1,112,688 KB) |
| Physical Memory | ~136 MB (136,028 KB) |
| Shared Memory | ~64 MB (64,640 KB) |
| Memory Usage % | 1.7% of total system memory |
The system demonstrates efficient resource utilization, with CPU usage indicating full utilization of two cores. Memory usage is minimal, with only 1.7% of the total system memory consumed, ensuring smooth operation even under heavy loads.
FPS Over Different Operating Conditions
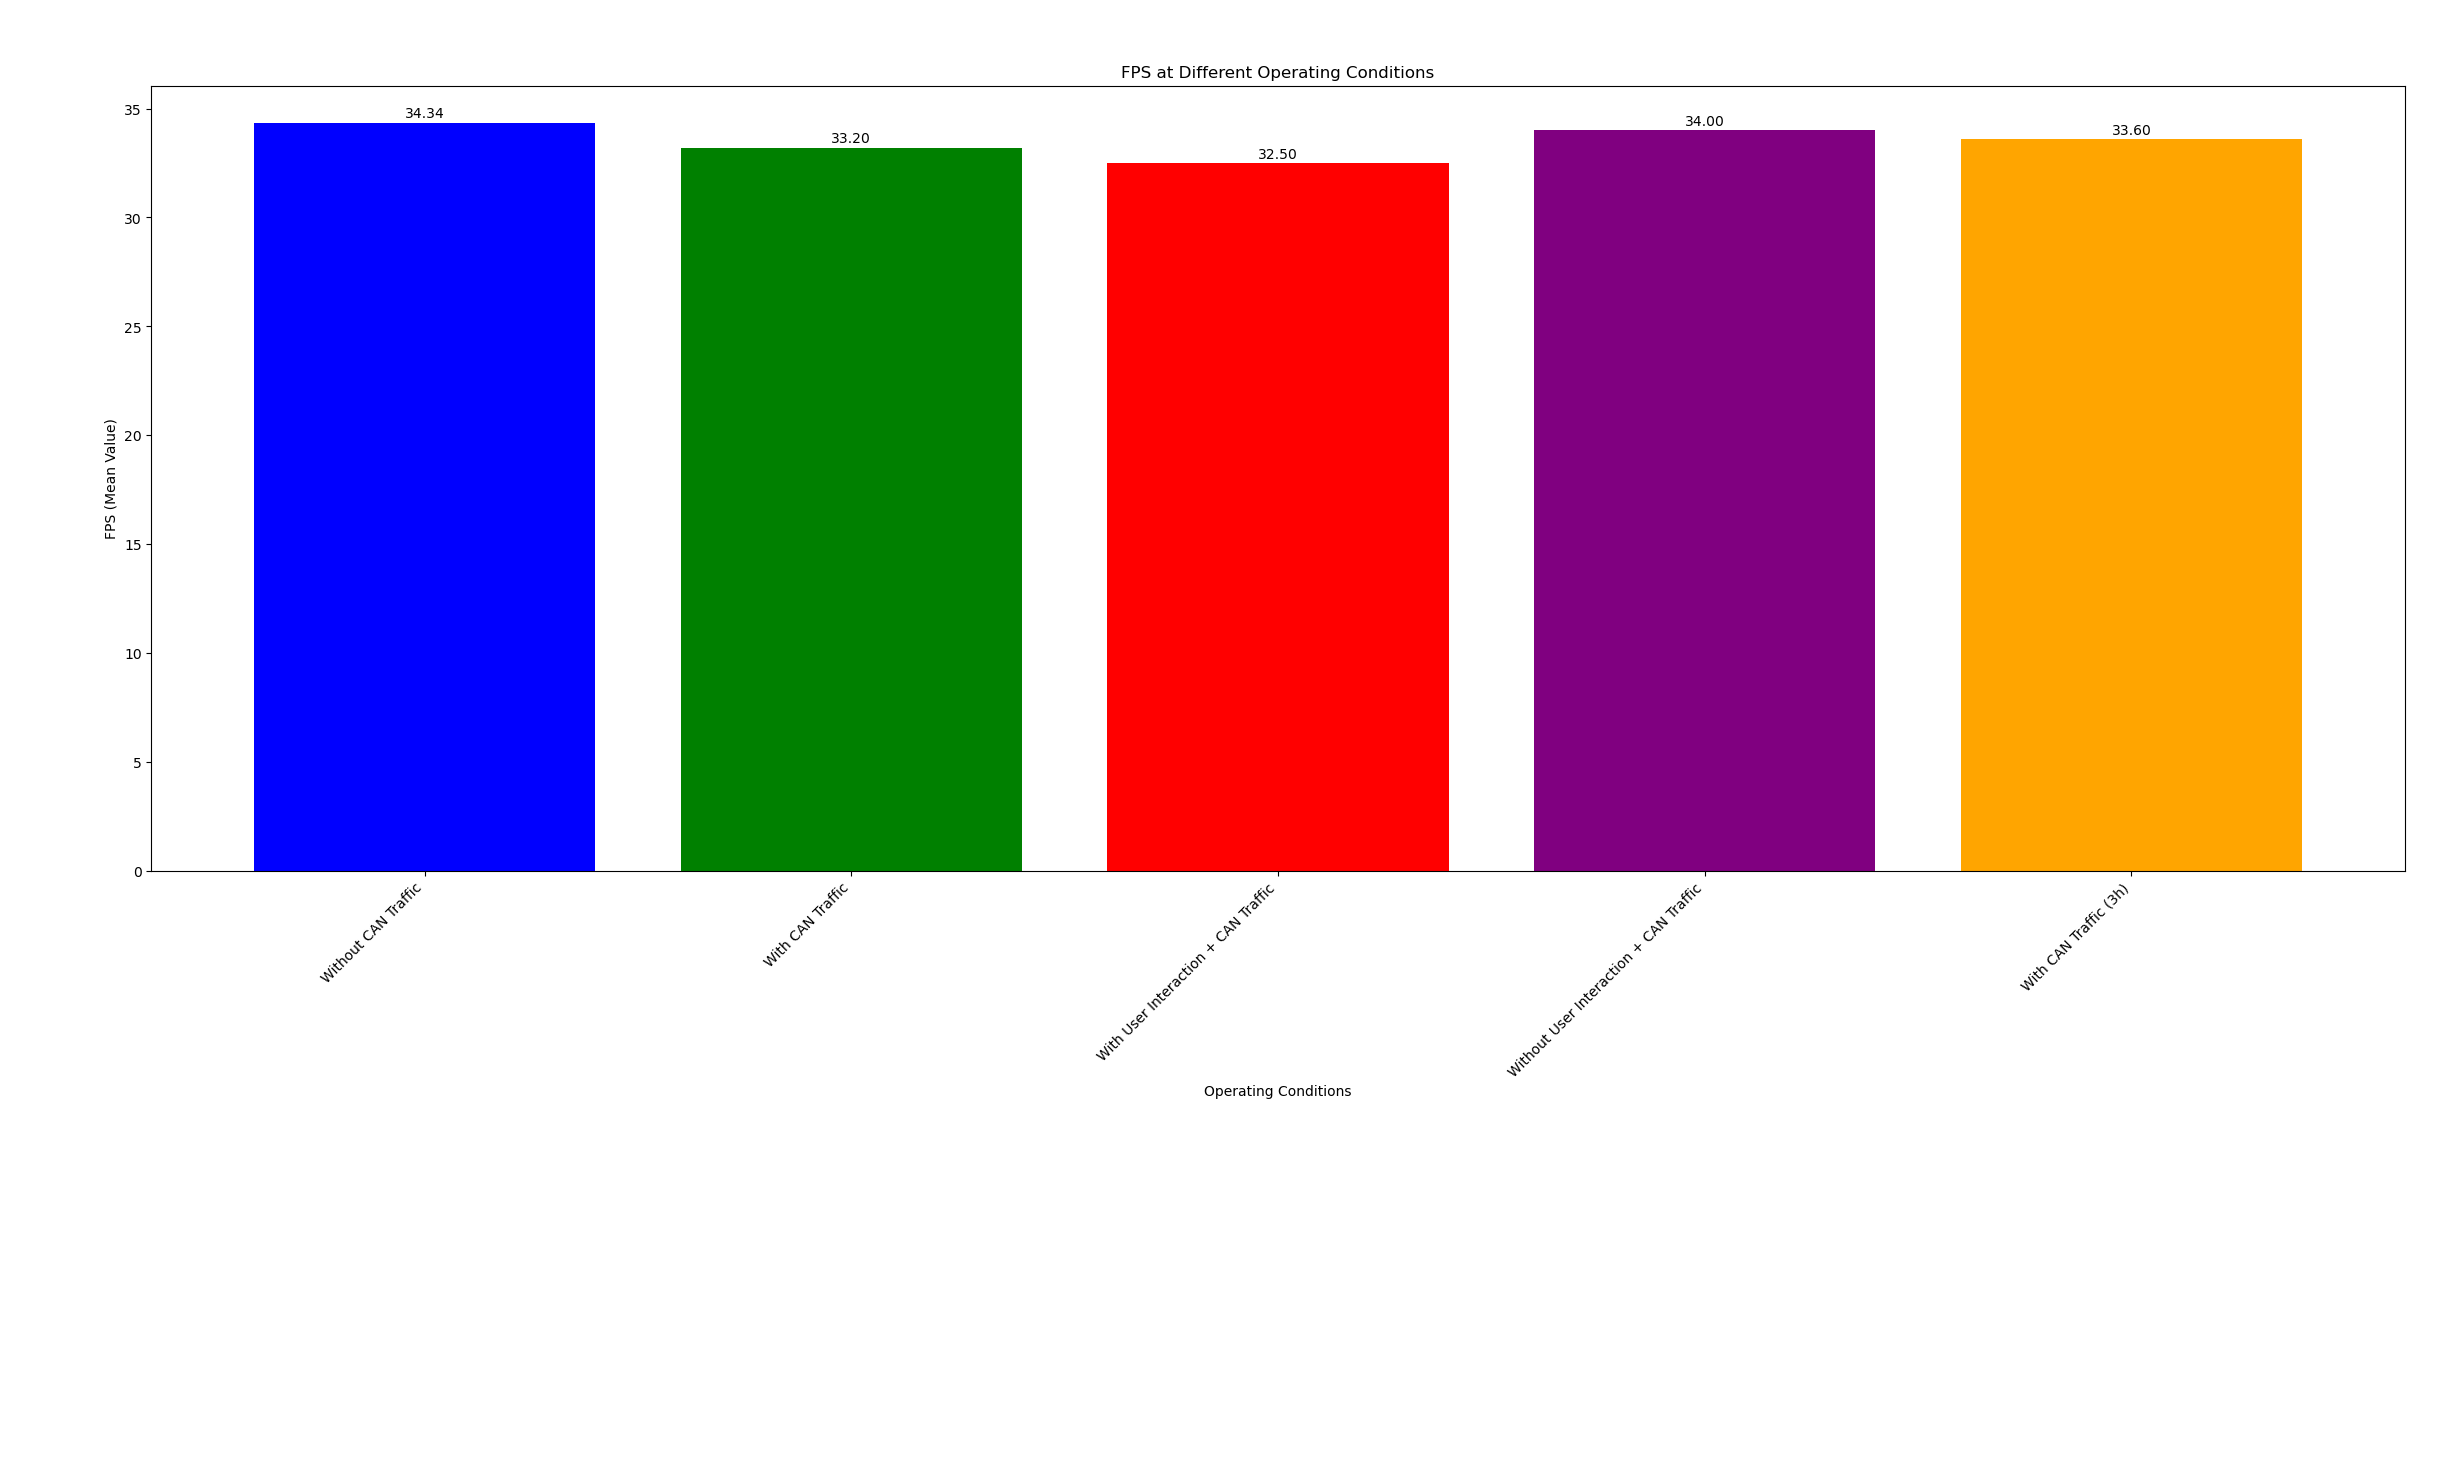
The framework maintains an average frame rate of 32 FPS on a 60Hz display, which is excellent for real-time monitoring and control. The performance was tested under various operating conditions, including continuous operation for 3 hours and during user interaction. The system consistently delivered stable performance, demonstrating its reliability and robustness.